Shopify A/B Testing Guide: 12 High-Impact Experiments to Run in 2026
Most Shopify store owners making $50K–$5M per year are leaving money on the table not because their traffic is bad, but because they’ve never systematically tested what converts it. According to VWO’s 2025 Experimentation Benchmark Report, stores that run consistent A/B tests see an average 20–30% improvement in conversion rate within 90 days. Shopify gives you a powerful platform, but it doesn’t tell you which headline, button color, or checkout flow is costing you sales — that’s what disciplined A/B testing on your Shopify store does.
This guide skips the theory. You’ll get 12 specific experiments ranked by impact, the exact tools to run them, Shopify Admin navigation paths, and the statistical benchmarks to know when a test is actually done.
- The highest-ROI Shopify A/B tests live on product detail pages (PDPs) and the checkout flow — start there, not the homepage.
- You need a minimum of 1,000 visitors per variant and 95% statistical significance before declaring a winner.
- Tools like Google Optimize’s successor (A/B Tasty), Convert.com, and Shogun are the go-to stack for Shopify experimentation in 2026.
- Shopify’s native Online Store 2.0 themes make it easier than ever to test sections without touching Liquid code.
- Combining Hotjar session recordings with GA4 funnel data before you test will cut your experiment runtime in half by surfacing the right hypotheses.
Why Most Shopify A/B Tests Fail Before They Start
The single biggest mistake store owners make is testing without a hypothesis. Changing a button from grey to green because you “heard it converts better” is not a test — it’s a guess with a dashboard attached.
A valid A/B testing hypothesis follows this structure: “Because [observation from data], we believe [change] will result in [outcome] for [audience segment].” For example: “Because Hotjar recordings show 62% of mobile visitors tap the product image carousel more than three times before adding to cart, we believe adding a zoom-on-tap feature will increase mobile add-to-cart rate by 10%.”
Before you run a single test on your Shopify store, do this groundwork:
- Install Hotjar on your store and watch at least 50 session recordings for each key page type (PDP, cart, checkout).
- Set up GA4 Enhanced Ecommerce tracking via the Shopify Admin → Settings → Customer events pixel panel, and build a funnel visualization: Landing page → PDP → Add to Cart → Checkout Initiated → Purchase.
- Identify the single biggest drop-off point in that funnel. That’s where your first test lives.
- Use Hotjar heatmaps on the drop-off page to pinpoint the specific element causing friction.
- Write your hypothesis before touching any design tool.
This pre-test audit typically takes 2–3 hours and will save you weeks of running underpowered, inconclusive experiments.
The Right A/B Testing Stack for Shopify in 2026
Google Optimize was sunset in 2023, and a lot of Shopify merchants haven’t replaced it properly. Here’s the current best-in-class stack depending on your store’s revenue tier.
| Tool | Best For | Shopify Compatible? | Starting Price (2026) | Statistical Engine |
|---|---|---|---|---|
| Convert.com | $200K+/year stores needing full control | Yes (script tag) | $699/month | Frequentist + Bayesian |
| A/B Tasty | Enterprise + personalization layer | Yes (script tag) | Custom pricing | Bayesian |
| Shogun A/B Testing | Visual page testing without code | Native Shopify app | $99/month | Frequentist |
| GemPages | Budget-friendly PDP split testing | Native Shopify app | $29/month | Frequentist |
| VWO (Visual Website Optimizer) | Mid-market with heatmaps + testing combined | Yes (script tag) | $399/month | Frequentist + SmartStats |
For stores between $50K–$500K/year, Shogun combined with GA4 and Hotjar is the most cost-effective stack. Above $500K, Convert.com’s segmentation capabilities and zero-flicker implementation make it worth the premium.
12 High-Impact A/B Tests for Your Shopify Store
1. Product Page Primary CTA — Button Text and Color
This is the highest-frequency test run on Shopify stores for good reason. The default “Add to Cart” copy is functional but passive. Testing variants like “Add to Bag,” “Get Yours Now,” or “Buy Now — Ships Today” can move the needle materially.
Navigate to Online Store → Themes → Customize → Product pages to edit button text in Online Store 2.0 themes without touching Liquid. For color, you’ll need to edit theme settings or use a testing tool to inject a CSS class change.
Expected lift: 5–15% add-to-cart rate improvement based on Shogun’s 2024 aggregate data across 3,200 Shopify stores.
2. Product Image Order and Format
The first product image is the single most-viewed element on any PDP. Test lifestyle imagery in position one versus white-background product shots. For apparel, test model imagery versus flat lay. Hotjar scroll maps will show you within days whether one format drives more downward engagement.
3. Pricing Presentation — Anchoring and Formatting
Test showing the “compare at” price prominently (crossed out MSRP next to sale price) versus showing only the current price. Also test price formats: $47 vs $47.00 vs $46.99. Research from the Journal of Consumer Psychology shows charm pricing ($X.99) increases perceived value, but round numbers perform better for premium positioning. Your brand positioning determines which direction to test first.
4. Social Proof Placement on PDPs
Most themes render star ratings directly beneath the product title. Test moving a condensed review summary (e.g., “⭐ 4.8 — 1,240 reviews”) to just above the Add to Cart button. Using Okendo or Yotpo, you can implement this widget placement change without a developer. Baymard Institute data from 2025 indicates that review proximity to the CTA increases conversion by up to 12% on mobile.
5. Urgency and Scarcity Indicators
Test displaying “Only 3 left in stock” versus no inventory message versus a countdown timer for a sale. Use a Shopify app like Hurrify or a custom Liquid snippet pulling from product.variants[0].inventory_quantity. Be careful: fabricated scarcity has been shown to erode trust in returning customer segments — only use real inventory data.
6. Checkout — One-Page vs. Three-Step
Shopify’s native one-page checkout (rolled out broadly in 2023 and now standard on all plans) is worth testing against the legacy three-step flow if you’re still running the older version. Navigate to Settings → Checkout → Checkout layout to switch. Shopify’s own data shows one-page checkout reduces checkout abandonment by an average of 15.4% — but heavily customized three-step flows with strong trust signals sometimes outperform it for high-AOV stores.
7. Free Shipping Threshold Messaging in Cart
Test a dynamic “You’re $12 away from free shipping!” progress bar in the cart drawer versus no message. This is one of the highest-ROI experiments available because it simultaneously increases AOV and reduces cart abandonment. Apps like CartHook and the native Shopify cart customization in Checkout Extensibility handle this without code.
8. Product Bundling and Cross-Sell Placement
Using Rebuy’s Smart Cart, test showing “Frequently Bought Together” recommendations in the cart versus on the PDP versus both. Placement dramatically affects uptake rate. Rebuy reports a median AOV increase of 15–22% when cart-level recommendations are properly configured — but the right placement varies by product category and session length.
9. Homepage Hero — Offer-Led vs. Brand-Led
Test a hero section leading with a specific offer (“Free UK Shipping on Orders Over £40”) against one leading with brand storytelling (“Handcrafted in Cornwall since 2009”). Offer-led heroes typically win for new visitor segments; brand-led performs better for returning visitors. Segment your test results in GA4 by new vs. returning users to get the full picture.
10. Navigation — Mega Menu vs. Simple Dropdown
For stores with more than 50 SKUs, test a mega menu with category thumbnails versus a simple text dropdown. Navigate to Online Store → Navigation → Main menu to adjust structure, and use Hotjar click maps to validate engagement before and after. This test typically takes 3–4 weeks to reach significance given lower click frequency.
11. Email Capture — Popup Timing and Offer
Test exit-intent popups versus time-delayed (e.g., 8 seconds) for your Klaviyo list growth. Also test offer types: percentage discount (10% off) versus dollar amount ($5 off) versus free gift with first order. Klaviyo’s 2025 Email Benchmarks Report found that dollar-off offers outperform percentage discounts for average order values above $60.
12. Page Speed — Lazy Loading and Script Deferral
This one surprises people, but page speed is a legitimate A/B test target. Use PageSpeed Insights to identify your Largest Contentful Paint (LCP) baseline. Then implement lazy loading for below-the-fold images via Online Store → Themes → Edit code → theme.liquid (add loading="lazy" to image tags) and test the impact on bounce rate and conversion rate in GA4. Google’s Core Web Vitals data shows every 100ms reduction in LCP correlates with a 1.3% increase in conversion rate.
How Long Should You Run Each Shopify A/B Test?
Stopping tests early is the number-one statistical error in Shopify experimentation. Peeking at results after two days and declaring a winner when one variant is “up 40%” will cause you to make the wrong decision the majority of the time due to the multiple comparisons problem.
Follow this decision framework:
- Set your minimum sample size before starting. Use a free calculator like Evan Miller’s sample size tool. For a 5% baseline conversion rate, a 10% relative lift, 80% power, and 95% significance, you need approximately 7,400 visitors per variant.
- Set a fixed runtime of at least 2 full business cycles (typically 14 days minimum) to account for day-of-week and payday effects on purchase behavior.
- Only read results when both conditions are met — minimum sample AND minimum runtime — whichever comes last.
- Use Convert.com’s or VWO’s built-in significance calculators rather than manually checking percentages in a spreadsheet.
- Document every test outcome in a shared testing log (a Notion database works well) regardless of win or loss — losing tests are as valuable as winning ones for future hypothesis generation.
A/B Testing Benchmarks: What Good Looks Like on Shopify
| Metric | Shopify Store Average (2026) | Top Quartile | What to Test If You’re Below Average |
|---|---|---|---|
| Overall Conversion Rate | 1.4% | 3.5%+ | PDP layout, checkout flow, trust signals |
| Add-to-Cart Rate | 6–8% | 12–15% | CTA copy, image order, pricing display |
| Cart Abandonment Rate | 70–75% | Below 60% | Free shipping threshold, express checkout options |
| Checkout Completion Rate | 45–55% | 65–72% | One-page checkout, trust badges, payment method variety |
| Email Popup Conversion Rate | 2–3% | 6–8% | Offer type, trigger timing, design simplicity |
| Average Order Value (AOV) | $85–$120 | $150–$200+ | Bundle recommendations, free shipping thresholds, upsells |
What Is A/B Testing on a Shopify Store? (A Practical Definition)
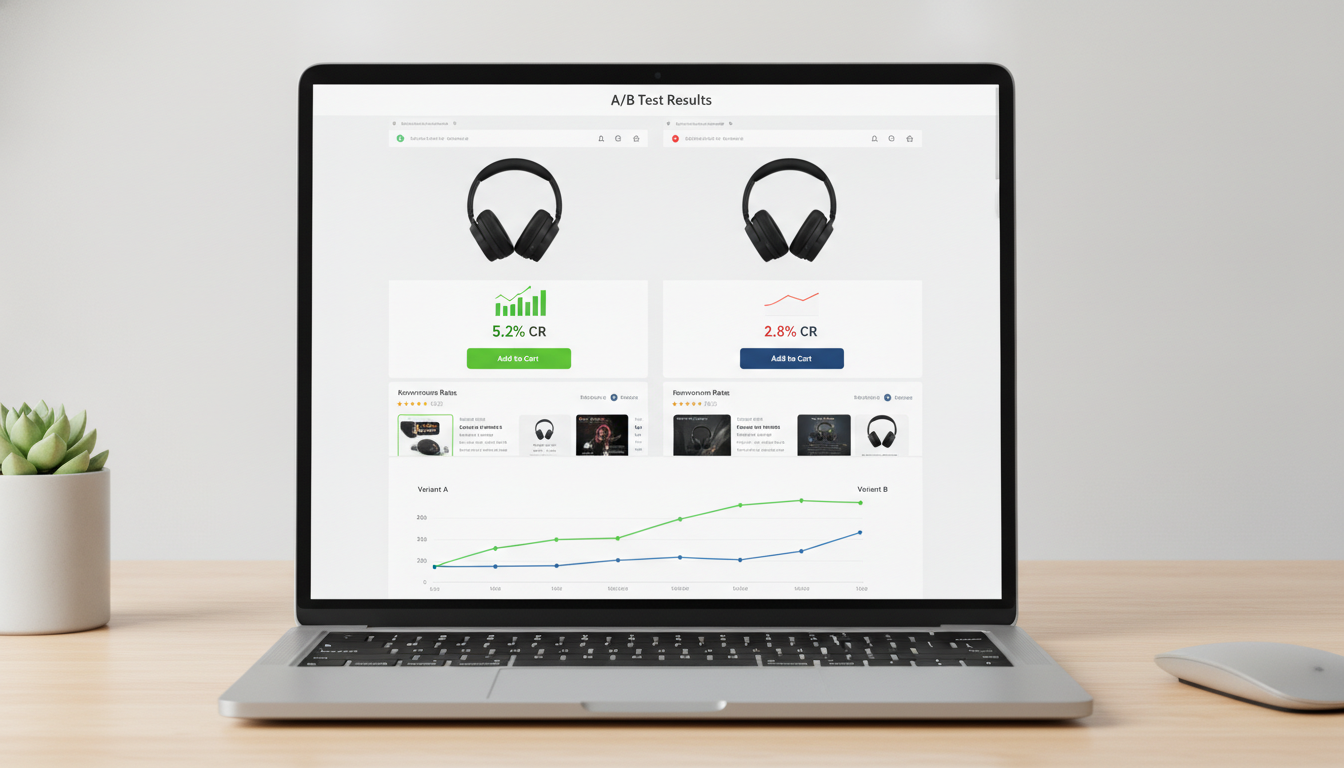
A/B testing on a Shopify store is the process of simultaneously showing two or more versions of a page element to different segments of your traffic, then measuring which version drives more of a target outcome — typically conversions, add-to-cart events, or revenue per visitor.
In a properly configured Shopify A/B test, your traffic is randomly split — 50% of visitors see Variant A (your control, i.e., the current version) and 50% see Variant B (the challenger). You measure performance over a statistically meaningful period, and the winning variant is then rolled out to 100% of traffic.
On Shopify specifically, there are three common implementation approaches:
- Client-side testing: A JavaScript snippet (from Convert.com, VWO, or A/B Tasty) loads after the page and modifies DOM elements to show the variant. Fastest to set up, but risks a “flicker” effect where users briefly see the control before the variant loads.
- Native app testing: Shopify-native page builders like Shogun or GemPages serve completely separate page URLs per variant. No flicker, easier to manage visually, but limited to full-page tests rather than element-level changes.
- Server-side testing: Variant logic runs before the page reaches the browser, typically via Shopify’s Storefront API or a headless setup. Zero flicker, most accurate, but requires developer involvement.
For stores on Online Store 2.0 themes (Dawn, Sense, Craft, or any modern third-party theme), client-side testing via Convert.com with their Shopify-specific anti-flicker snippet is the fastest path to a reliable test. For headless Shopify stores using Hydrogen or a Next.js frontend, server-side testing is the only viable approach.
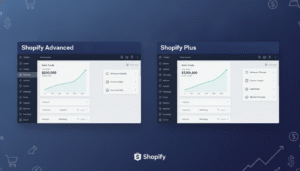
One critical distinction specific to Shopify: you cannot A/B test the native Shopify checkout pages (cart.liquid, checkout) on plans below Shopify Plus. On Plus, Checkout Extensibility (the replacement for checkout.liquid as of August 2024) allows you to add custom UI components that can be A/B tested using third-party tools or the native Shopify Functions framework.
How to Set Up A/B Testing on Shopify: Step-by-Step
Here’s the complete process for running your first properly configured Shopify A/B test using Convert.com as the example platform (the methodology applies to VWO and A/B Tasty as well).
Step 1: Install Convert.com on Your Shopify Store
- Create a Convert.com account and copy your project’s JavaScript snippet.
- In your Shopify Admin, go to Online Store → Themes → Edit code → theme.liquid.
- Paste the Convert.com snippet immediately after the opening
<head>tag to minimize flicker. - Save and verify installation using Convert.com’s Chrome extension.
Step 2: Connect GA4 for Revenue Tracking
- In your Shopify Admin, go to Settings → Customer events and confirm your GA4 property is connected via the Google & YouTube channel.
- In Convert.com, set up a Revenue goal using GA4’s
purchaseevent and map the revenue value to GA4’svalueparameter. - Test a purchase in a staging environment to confirm revenue data flows through correctly before launching any experiment.
Step 3: Build Your Variant
- In Convert.com, create a new A/B experiment and select “Visual Editor.”
- Enter your PDP URL. The visual editor will load your page in an iframe.
- Make your change — for example, edit the button text from “Add to Cart” to “Add to Bag — Ships in 24 Hours.”
- Set traffic split to 50/50 and apply URL targeting rules (e.g., only product pages matching
/products/*).
Step 4: Define Goals and Launch
- Set your primary goal as “Add to Cart” click event or GA4 purchase conversion.
- Set a secondary goal as Revenue per Visitor to catch cases where a variant improves micro-conversions but reduces AOV.
- Calculate your required sample size using Evan Miller’s tool and set that as your minimum before reading results.
- Launch the experiment and resist checking results for at least 7 days.
Why Shopify A/B Tests Produce Inconclusive or Wrong Results
Running tests that produce no clear winner — or worse, a false winner — is a waste of time and often leads to poor product decisions. Here are the most common causes specific to Shopify stores and how to eliminate them.
Insufficient Traffic Volumes
This is the most common issue. If your Shopify store gets 500 sessions per month on a given product page, you cannot reach statistical significance on a conversion rate test in any reasonable timeframe. A test requiring 7,000 visitors per variant at 500 monthly sessions would need over a year to complete — by which point seasonality and external factors have completely corrupted the results.
The fix: Prioritize A/B tests on your highest-traffic pages first — typically your homepage, a hero collection page, or your top three bestselling PDPs. Use GA4 (navigate to Reports → Engagement → Pages and screens) to rank pages by session volume before selecting test targets.
Testing Multiple Changes at Once
Changing the headline, the image, the button text, and the price display in a single “variant” makes it impossible to know what drove the result. If the variant wins, you don’t know which change to keep. If it loses, you don’t know what to fix. This is a multivariate test being incorrectly run as an A/B test.
The fix: One variable per test. If you want to test multiple elements, either run sequential A/B tests (test one element, implement winner, then test next element) or use a proper multivariate testing setup in VWO or Convert.com — which requires 4x the traffic of a standard A/B test.
Novelty Effect
Returning customers who’ve seen your old design may interact differently with a new variant simply because it’s new, not because it’s better. This artificially inflates variant performance in the first few days.
The fix: Segment your results in GA4 by new versus returning visitors. If a variant shows a massive win for returning users in week one that disappears in week three, the novelty effect is likely at play. Let the test run until the returning-visitor segment stabilizes.
Shopify Theme Conflicts and Script Loading Issues
Shopify stores often run 15–30 third-party apps, each injecting JavaScript. A slow-loading testing script can cause the variant to flash in after the control renders, or fail to render on certain devices entirely. Hotjar’s 2025 data shows that flicker rates above 3% of test sessions produce statistically unreliable results.
The fix: Use Convert.com’s async anti-flicker snippet, which hides the page body until the variant has loaded. Monitor flicker rate in Convert.com’s diagnostics panel. Also run PageSpeed Insights on both control and variant URLs to confirm the test script isn’t degrading your Core Web Vitals scores during the experiment.
How to Prevent Wasted A/B Testing Cycles on Shopify
Running experiments that teach you nothing is expensive — not just in tool costs but in opportunity cost. Every week you run a broken test is a week you’re not gathering insights that compound into real revenue gains. Here’s how to build a testing program that consistently produces actionable results.
Build a Testing Backlog Using Qualitative Data First
Before writing a single hypothesis, spend two weeks in observation mode. Set up Hotjar Heatmaps and Session Recordings on your top five highest-traffic pages. Set up a Hotjar Survey on your checkout page with the single question: “What almost stopped you from completing your purchase today?” The answers — collected from 50–100 real customers — will give you more high-quality hypotheses than any CRO blog post can.
Combine this with GA4 funnel analysis. In GA4, build a funnel under Explore → Funnel exploration mapping your full purchase path. Identify the step with the highest abandonment rate — that’s your top-priority test zone.
Prioritize Tests with the ICE Framework
The ICE scoring framework (Impact, Confidence, Ease) helps you rank your testing backlog so you’re always running the experiments with the highest expected return first.
- Impact (1–10): How much could this change move your primary metric if it wins?
- Confidence (1–10): How much qualitative and quantitative evidence supports this hypothesis?
- Ease (1–10): How technically complex is this test to implement?
Score each hypothesis, average the three numbers, and run experiments in descending order. A test scoring 8/10 on Impact, 7/10 on Confidence, and 9/10 on Ease (average 8.0) should run before one scoring 9/5/3 (average 5.7), even though the second has higher potential impact.
Document and Share All Results — Including Losses
A Notion database or Google Sheet tracking every test run, its hypothesis, results, and learnings is one of the highest-leverage assets a Shopify store can build over time. Stores that maintain an active test log compound their CRO knowledge — each test informs the next, and patterns emerge across product categories, customer segments, and seasonal cycles.
Share this log with your email marketing team. A winning A/B test result on your PDP should directly inform the next Klaviyo flow or campaign — if urgency messaging increases on-site conversion by 18%, test it in your abandoned cart emails next.
Respect Seasonality Windows
Never start a new A/B test within three weeks of Black Friday, a major product launch, or any event that will significantly skew your traffic composition. Paid traffic surges, email-driven traffic spikes, and influencer campaigns all introduce self-selection bias that contaminates your test population. Block out “testing freeze” periods in your calendar and plan your experiment schedule around them proactively.
Integrating A/B Testing Results Across Your Shopify Stack
A winning A/B test result should not live in isolation on your testing platform. The insight needs to flow through your entire Shopify ecosystem to compound its impact.
When a PDP test variant wins, implement these follow-on actions:
- Update your Klaviyo product recommendation templates to mirror the winning image format and CTA copy across abandoned cart and post-purchase flows.
- Apply the winning variant logic to similar pages using Online Store 2.0 section presets — navigate to Online Store → Themes → Customize → Templates to push section changes across all product templates.
- Update your Google Shopping feed via the Google & YouTube Shopify channel to use the winning product image if an image format test won — listing image quality directly impacts Google Shopping CTR.
- Feed the result into your Rebuy personalization rules — if a specific social proof format won on PDPs, mirror that format in Rebuy’s Smart Cart widget copy.
Running A/B tests in isolation is how you get incremental 5% gains. Propagating winning insights systematically across your Shopify stack is how you compound those gains into a fundamentally higher-converting store over 12–18 months.
Building a Sustainable Shopify A/B Testing Cadence
The stores that extract the most value from A/B testing are not the ones running the most tests — they’re the ones running the most informed tests at a consistent cadence. Here’s a realistic testing rhythm for a Shopify store doing $200K–$2M/year:
- Monthly: One active experiment running at all times on your highest-traffic page type.
- Quarterly: A full qualitative audit (Hotjar recordings + GA4 funnel review + one customer survey) to refresh your hypothesis backlog.
- Bi-annually: A full theme audit using PageSpeed Insights and GA4 behavior flow to identify structural friction points worth a larger-scale experiment.
At this cadence — roughly 10–12 experiments per year — stores consistently running structured A/B tests on Shopify accumulate enough data within 18 months to make evidence-based decisions on every major design or copy change, rather than relying on opinion.
The compounding effect is real: Conversion Rate Experts’ 2025 client data shows that stores maintaining an active testing program for 24+ months achieve 2–4x higher conversion rates than their category benchmarks — not from any single winning test, but from the accumulated weight of dozens of marginal improvements, each built on the validated learning of the last.
Start with your biggest traffic drop-off point, write one rigorous hypothesis, run one clean test, and document what you learn. That single disciplined experiment is worth more than a hundred unvalidated redesigns.