Shopify A/B Testing Guide: 12 High-Impact Experiments to Run in 2026
Your Shopify store is leaving money on the table right now — and the frustrating part is you probably can’t see exactly where. According to the Baymard Institute, the average documented e-commerce cart abandonment rate sits at 70.19% — meaning roughly 7 out of every 10 shoppers who add something to their cart never complete the purchase. A/B testing on Shopify is the most reliable method to diagnose and close that gap, one controlled experiment at a time.
Most store owners run A/B tests wrong: they test button colors when they should be testing price anchoring, or they kill a variant after 200 sessions instead of waiting for statistical significance. This guide cuts through that noise. You’ll get 12 specific experiments ranked by impact, the exact tools to run them, and the admin paths to implement changes — all grounded in what’s working on Shopify stores in 2026.
- The highest-ROI Shopify A/B tests target product pages, checkout flow, and above-the-fold hero sections — not cosmetic elements like button colors.
- You need a minimum of 1,000 unique visitors per variant and 95% statistical confidence before calling any test a winner.
- Tools like Google Optimize’s successor (A/B Tasty), Convert.com, and Shoplift are purpose-built for Shopify’s Liquid architecture in 2026.
- Combining Hotjar session recordings with Google Analytics 4 (GA4) behavioral data gives you the qualitative + quantitative foundation every winning hypothesis needs.
- Shopify’s native metafields and theme sections make it possible to run true server-side tests without page flicker — a critical upgrade from client-side JavaScript splits.
Why A/B Testing on Shopify Is Different From Standard Web Testing
Shopify’s Liquid templating engine, its hosted checkout (now fully customizable via Shopify Plus’s Checkout Extensibility), and its app ecosystem create a testing environment that’s genuinely distinct from WordPress or custom-built storefronts. You can’t simply drop a JavaScript snippet and split-test anything you want — some areas, particularly the native checkout, have guardrails.
Here’s what makes Shopify-specific A/B testing unique in 2026:
- Checkout pages are controlled by Shopify and can only be customized (and therefore tested) via Checkout Extensions on Shopify Plus — standard plans cannot modify checkout HTML directly.
- Theme sections are modular and JSON-based since Shopify 2.0, making it far easier to build test variants inside the theme editor without touching raw Liquid code.
- Third-party apps (Rebuy, Okendo, Klaviyo pop-ups) render inside the DOM after page load, which means client-side A/B testing tools may conflict with app-injected elements — always QA on mobile and desktop after launching a test.
- Server-side testing via the Storefront API or Hydrogen (Shopify’s React-based headless framework) gives you flicker-free splits and is the standard approach for stores doing $500K+ annually.
Bottom line: understand your Shopify plan tier and your tech stack before choosing a testing tool. A Shopify Basic store owner should start with Shoplift or Convert.com. A Shopify Plus merchant running Hydrogen should architect server-side experiments from day one.
The A/B Testing Tools Worth Using on Shopify in 2026
The testing tool market consolidated significantly after Google Optimize shut down in September 2023. Here’s the honest breakdown of what’s actually worth using on Shopify today:
| Tool | Best For | Shopify Compatibility | Starting Price (2026) | Statistical Model |
|---|---|---|---|---|
| Shoplift | Shopify-native theme testing | All Shopify plans (deep native integration) | $99/mo | Bayesian |
| Convert.com | Mid-market stores, advanced segmentation | All plans (JavaScript snippet) | $299/mo | Frequentist + Bayesian |
| A/B Tasty | Enterprise / Shopify Plus | Plus (server-side support) | Custom pricing (~$1,200+/mo) | Bayesian with power analysis |
| VWO (Visual Website Optimizer) | Full CRO suite with heatmaps | All plans | $314/mo (Growth plan) | Frequentist + SmartStats |
| Intelligems | Price testing specifically | All Shopify plans | $150/mo | Bayesian |
| Hotjar | Qualitative research (not split testing) | All plans (heatmaps, recordings) | $39/mo (Plus) | N/A — observational only |
Recommendation for most stores ($100K–$1M/year): Run Shoplift for theme-level tests and Intelligems for price experiments. Pair both with Hotjar for session recordings and GA4 for behavioral funnel data. That stack costs under $400/month and covers 90% of what agencies charge $5,000/month to manage.
How to Build a Testing Hypothesis That Actually Wins
A random A/B test is just noise with extra steps. Every experiment needs a structured hypothesis built from real behavioral data. Follow this three-step research framework before you write a single line of test code.
Step 1: Mine GA4 for Drop-Off Points
In GA4, go to Reports → Monetization → Purchase Journey. This funnel report shows you exactly where users fall off between product view, add-to-cart, begin checkout, and purchase. If you see a 60%+ drop between “Add to Cart” and “Begin Checkout,” your cart page is the highest-priority test target — not your homepage.
Step 2: Watch Hotjar Session Recordings Filtered by Exit Pages
In Hotjar, navigate to Recordings → Filter by: Exit Page → [your highest drop-off URL]. Watch 20–30 recordings. You’re looking for rage clicks, scroll depth below 30%, and users who hover over the buy button without clicking. These micro-behaviors tell you what is creating friction, which becomes the basis for your hypothesis.
Step 3: Write the Hypothesis in This Exact Format
Use this structure: “Because [observation from data], if we [specific change], then [metric] will [direction] by approximately [range], measured over [timeframe].”
Example: “Because Hotjar recordings show 40% of mobile users scrolling past the Add to Cart button without tapping it (suggesting they don’t see it), if we make the ATC button sticky on mobile product pages, then mobile add-to-cart rate will increase by 10–20%, measured over 3 weeks.”
This format forces specificity and prevents you from testing based on opinions or aesthetic preferences.
12 High-Impact A/B Tests for Your Shopify Store
These experiments are ranked roughly by expected revenue impact, based on aggregate data from CRO agencies and Shopify’s own merchant insights reports.
1. Sticky Add-to-Cart Bar on Mobile Product Pages
On mobile, users scroll past the ATC button constantly. A sticky bar that follows the user down the page keeps the primary CTA visible at all times. Shoplift’s aggregate data shows this test produces a median 12% lift in mobile add-to-cart rate. Implement via your theme’s product.liquid or through a Shopify 2.0 section block — no app required on most modern themes.
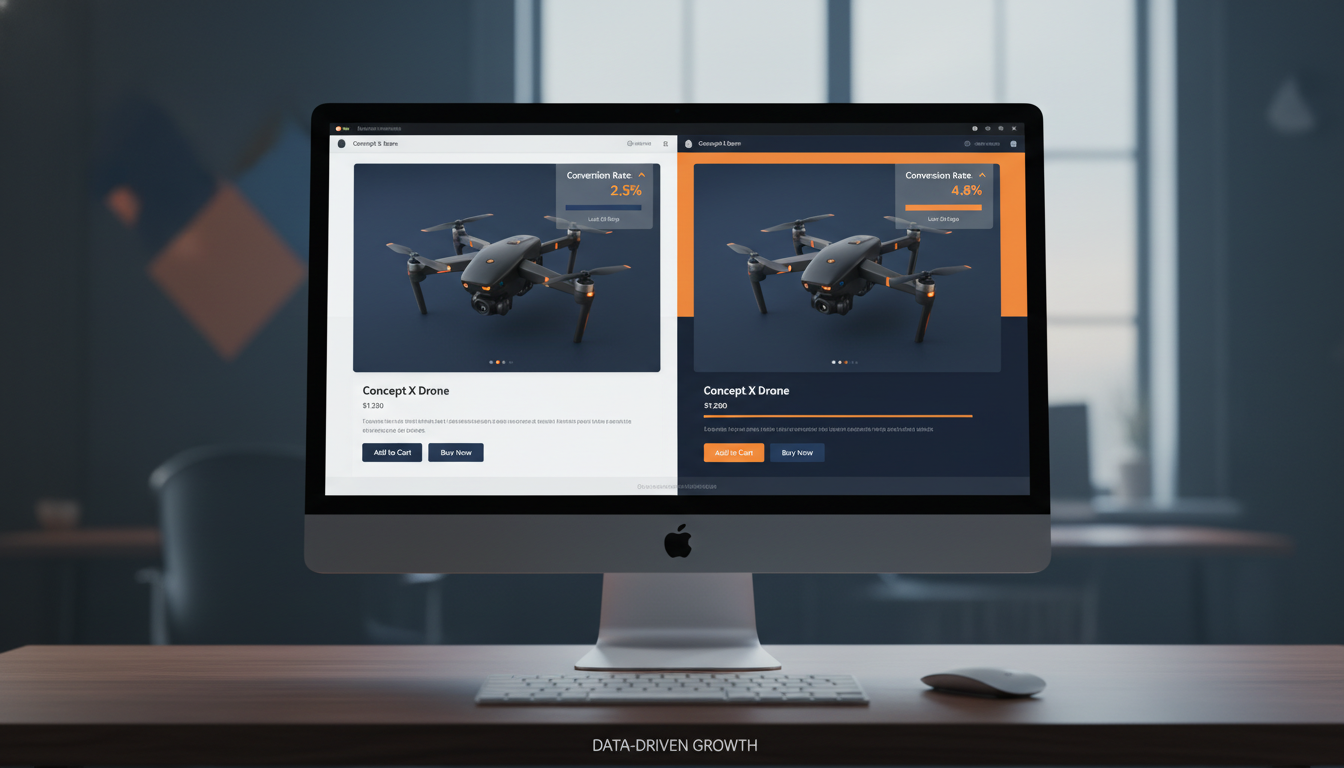
2. Product Page Image Order (Lifestyle First vs. Product First)
Test leading with a lifestyle/in-context image versus a clean white-background product shot as the hero image. For fashion, home goods, and beauty brands, lifestyle-first variants routinely outperform — but the opposite is true for technical/B2B products. This is one of the easiest tests to run in the Shopify theme editor under Online Store → Themes → Customize → Product pages.
3. Price Anchoring and Comparison Pricing Display
Show a “Compare at Price” (original price struck through) alongside the current price. In the Shopify Admin, set this under Products → [Select Product] → Pricing → Compare at price. Test showing the percentage saved (“Save 23%”) versus showing the dollar amount saved (“Save $14”). Intelligems is purpose-built to run this type of price perception test with revenue-level significance tracking.
4. Above-the-Fold Hero Section on Homepage
Test headline copy that leads with the customer outcome (“Wake Up Without Back Pain”) versus a brand/product statement (“Introducing the ErgoForm Pillow”). Outcome-led headlines consistently outperform product-led ones in direct-response categories. Use Convert.com to serve two different homepage section blocks to 50/50 traffic splits.
5. Trust Badges Placement on Product Pages
Test trust signals (free returns, SSL badge, money-back guarantee) placed directly below the ATC button versus below the product description. Baymard Institute research indicates that 17% of shoppers abandon checkout because they didn’t trust the site with their card details — surfacing trust signals higher in the page flow addresses this before the user reaches checkout.
6. Quantity Selector vs. Quantity Dropdown
A simple +/– stepper button consistently outperforms a quantity dropdown for stores with average order quantities above 1. If you sell consumables, supplements, or gift products, test replacing the native Shopify quantity dropdown with a stepper widget. This is a pure Liquid/CSS change — no app needed.
7. Upsell Placement: Product Page vs. Cart Page vs. Post-Purchase
Rebuy’s Smart Cart allows you to A/B test upsell and cross-sell widget placement natively. Test product-page upsells (“Frequently Bought Together”) against cart-drawer upsells against post-purchase one-click upsells. Post-purchase upsells on Shopify Plus convert at 8–15% on average (Rebuy, 2025) — often the highest-converting placement because the buying decision friction is already gone.
8. Klaviyo Email Capture Pop-Up: Timing and Offer
Test a pop-up triggering at 5 seconds vs. exit-intent. Also test the offer: 10% off vs. free shipping vs. a free gift with first order. In Klaviyo, go to Sign-up Forms → Create Form → Configure display rules to set timing triggers. Track submission rate and downstream email revenue per subscriber — a 10% discount pop-up may drive more sign-ups but attract lower-LTV customers than a content-based offer.
9. Collection Page Layout: Grid Size and Filters
Test a 2-column mobile grid versus a 3-column grid. Larger product images reduce cognitive load but show fewer products above the fold — the optimal layout varies significantly by product category and average price point. Also test showing filters expanded by default versus collapsed — Hotjar click maps will show you exactly how many users engage with filters in each variant.
10. Checkout: Single-Page vs. Three-Step (Plus Only)
Shopify Plus merchants can test Shopify’s one-page checkout (launched in 2023 and now the default) against a multi-step flow using Checkout Extensibility. In most categories, Shopify reported that its one-page checkout lifted conversions by an average of 4% in its own internal rollout data. If you’re on Plus and still haven’t migrated to one-page checkout, do it — then test UI variations within that format.
11. Social Proof: Review Count vs. Review Stars vs. UGC Photos
Test three variants of social proof near the ATC button: (a) star rating + review count (“⭐ 4.8 — 1,243 reviews”), (b) a single pull-quote testimonial, or (c) a row of customer UGC photos powered by Okendo. Okendo’s own benchmark data shows that UGC photo displays increase conversion rate by an average of 9% compared to star ratings alone for fashion and beauty verticals.
12. Free Shipping Threshold Messaging
Test a dynamic banner in the cart that says “You’re $12 away from free shipping!” versus no banner. This is one of the highest-ROI tests for stores that offer a free shipping threshold. Studies by the NRF show that 75% of consumers expect free delivery even on orders under $50 — making threshold messaging a powerful motivator to increase AOV. Rebuy’s Smart Cart includes this functionality out of the box.
What Is A/B Testing on a Shopify Store? (Full Explanation)
A/B testing on a Shopify store is the practice of simultaneously showing two or more versions of a page element, page, or user flow to different segments of your live traffic, then measuring which version drives a statistically significant improvement in a target metric — most commonly conversion rate, add-to-cart rate, average order value (AOV), or revenue per visitor (RPV).
In the Shopify context, a “variant” is typically a modified version of a theme section, product page layout, collection filter, cart drawer, or checkout step. The “control” is your existing, unchanged version. Traffic is split — usually 50/50 for two-variant tests — using either a JavaScript-based tool (Convert.com, VWO) that intercepts page loads, or a server-side split where different theme templates or Storefront API responses are served to different user segments.
The critical distinction most store owners miss: A/B testing is not the same as “making changes and watching your analytics.” True A/B testing requires simultaneous exposure — both variants running at the same time, to randomized user segments, over the same time period. Running version A in January and version B in February invalidates your data because seasonal traffic differences, not your change, may explain the result.
A statistically valid Shopify A/B test requires:
- A clear primary metric (e.g., checkout conversion rate — not “overall traffic”)
- A minimum sample size — use a calculator like Evan Miller’s sample size tool; most Shopify stores need 1,000–2,000 sessions per variant for 95% confidence
- A pre-defined test duration — run for at least one full week to capture weekday/weekend behavioral differences, ideally two to four weeks
- No mid-test changes — changing any other site element during an active test contaminates your results
- Segment-level analysis — always break results down by device type (mobile vs. desktop) since Shopify stores typically see 65–75% of traffic from mobile, and mobile behavior differs dramatically from desktop
For Shopify stores doing under $200K/year, the lack of traffic volume is often the biggest obstacle to valid testing. If your product page gets 300 sessions per month, a standard A/B test will take six months to reach significance — by which time the data is stale. In these cases, focus on multivariate qualitative research (Hotjar recordings, customer interviews, post-purchase surveys via tools like Fairing) and implement best-practice changes with confidence rather than waiting for inconclusive test data.
How to Set Up A/B Testing on Shopify: Step-by-Step
Here’s the exact process to run your first statistically valid A/B test on a Shopify store using Shoplift, which offers the most seamless native integration as of 2026.
- Install Shoplift from the Shopify App Store. Go to Apps → Shopify App Store → Search “Shoplift” → Install. Grant the required permissions for theme access.
- Define your test goal inside Shoplift’s dashboard. Select from pre-built metrics: Add to Cart Rate, Checkout Rate, Purchase Rate, or Revenue Per Session. Choose “Purchase Rate” as your primary metric for most tests.
- Create a variant by duplicating your current theme section. In Shoplift, click New Test → Select Page Type → Duplicate Section → Edit Variant. Make your single, isolated change (e.g., move the trust badges above the fold).
- Set traffic split. For your first test, use 50/50. If you want to protect revenue on a riskier variant, use 80/20 (80% control, 20% variant) until you see early directional data.
- Connect GA4 by navigating to Shoplift → Settings → Integrations → Google Analytics 4. Enter your GA4 Measurement ID (found in GA4 under Admin → Data Streams → Web → Measurement ID). This lets you cross-reference Shoplift’s data with GA4 behavioral segments.
- Launch the test and set a calendar reminder for your minimum duration (typically 14 days for stores with 5,000+ monthly sessions).
- Analyze results only after hitting your pre-defined sample size AND duration. Look at Shoplift’s confidence interval — only implement the winner if confidence is ≥95%. If the result is inconclusive, the test is still valuable: it tells you the element doesn’t have a significant impact and should be deprioritized.
- Implement the winner by publishing the winning variant to 100% of traffic directly from the Shoplift dashboard. Shoplift pushes the change to your live theme without requiring manual code edits.
- Document the result in a shared test log (a simple Notion or Google Sheet works). Record: hypothesis, variant description, test duration, sessions per variant, winning metric, lift percentage, and confidence level. This log becomes a compounding asset — after 20 tests, you’ll see patterns unique to your audience.
Why Most Shopify A/B Tests Fail to Produce Actionable Results
The majority of Shopify A/B tests fail not because testing doesn’t work, but because of execution errors that invalidate the data before you even analyze it. Understanding the root causes helps you avoid the same traps.
The most common failure modes, and how to fix them:
Insufficient Traffic Volume
Running a test on a page that gets 200 sessions per month means you need 10+ months to reach significance — an impossible timeline. Fix: concentrate tests on your highest-traffic pages first (usually the homepage, top collection page, and best-selling product page). Use Shoplift’s built-in sample size estimator before launching any test. If you don’t have enough traffic, don’t test — implement best-practice changes and focus on traffic growth first.
Calling Tests Too Early (Peeking Problem)
Checking results daily and stopping the test as soon as one variant pulls ahead is one of the most damaging mistakes in A/B testing. Optimizely’s research shows that stopping a test early inflates false positive rates to as high as 40% — meaning nearly half of “winning” tests that were stopped early would have regressed to the mean. Fix: set a minimum duration and a minimum sample size in advance, and don’t touch the test until both conditions are met.
Testing Multiple Elements Simultaneously
Changing the headline, button color, image, and price display all at once in your “variant B” makes it impossible to know which element drove the result. Fix: test one element at a time. The only exception is a full-page redesign test (challenger vs. control), which is valid when you want to test a completely different strategic direction before optimizing individual elements.
Ignoring Seasonality and External Events
Running a test during Black Friday/Cyber Monday, a major product launch, or a PR spike will contaminate your data because traffic behavior and intent during those periods is fundamentally different from normal baseline behavior. Fix: pause active tests during any promotional period where traffic patterns deviate significantly from your baseline. Resume after traffic normalizes.
Not Segmenting by Device Type
An aggregate conversion rate lift of 3% can mask a 15% lift on desktop and a 9% decline on mobile — implementing the “winner” globally would hurt your business. Fix: always segment results by device type in GA4 and in your testing tool before declaring a winner. On Shopify stores, mobile traffic typically represents 65–75% of sessions (Shopify Commerce Trends Report, 2026), so a mobile-negative result is usually a test failure regardless of aggregate performance.
How to Prevent Bad A/B Tests From Damaging Your Shopify Revenue
Prevention is about building safeguards into your testing process before you launch, not auditing damage after the fact. Here’s the operational framework that prevents bad tests from hurting your store.
Implement a Pre-Launch QA Checklist
Before any variant goes live, verify:
- The variant renders correctly on iPhone (Safari), Android (Chrome), and desktop (Chrome and Safari) — use BrowserStack if you don’t have physical devices
- No JavaScript conflicts with Rebuy, Klaviyo, Okendo, or other app-injected elements
- Page speed impact is neutral or positive — run PageSpeed Insights on both control and variant URLs before launch; a variant that lifts conversion rate but adds 2 seconds of LCP will net-negative your SEO rankings over time
- The GA4 conversion event fires correctly on the variant — use GA4’s DebugView (in Admin → DebugView) to confirm purchase events are tracking
Set Revenue Guardrails
Configure your testing tool to automatically pause a variant if revenue per session drops more than 15% below the control within the first 72 hours. Both Convert.com and VWO support automated traffic re-routing based on revenue guardrails. This protects you from a high-risk variant tanking your revenue before you notice manually.
Maintain a Test Backlog, Not a Test Queue
Run only one test per page template at a time. Keep additional hypotheses in a prioritized backlog scored by ICE framework (Impact, Confidence, Ease — each scored 1–10, averaged). The highest ICE-scored items go to the front of the queue. This prevents the trap of running too many simultaneous tests whose interactions you can’t isolate.
Separate Test Environments for Shopify Plus
If you’re on Shopify Plus, use a development store (Go to Shopify Admin → Settings → Plan → Development stores) to QA variants before they go live. For headless Shopify stores on Hydrogen, use preview URLs with Vercel or Netlify branch deployments to test the variant in a production-identical environment without exposing it to live traffic.
The A/B Testing Cadence That Actually Moves the Needle
The stores that see compounding gains from A/B testing treat it as an ongoing program, not a one-off project. The cadence that works for most Shopify stores doing $200K–$2M/year:
- Monthly: Launch 1–2 new tests. Review results from tests that have hit their minimum duration. Update the ICE-scored backlog.
- Quarterly: Run a full CRO audit using Hotjar heatmaps + GA4 funnel reports to identify new high-priority hypothesis areas. Review your test log for patterns (e.g., “social proof tests consistently win on mobile — let’s double down there”).
- Annually: Benchmark your core conversion metrics (add-to-cart rate, checkout rate, purchase rate) against industry standards. A healthy Shopify store in 2026 should target: add-to-cart rate of 8–12%, checkout initiation rate of 55–65% of cart sessions, and purchase conversion rate of 2.5–4.5% (varies significantly by traffic source and category).
At this cadence, running 12–18 tests per year, even a 25% win rate (which is realistic — most tests are inconclusive, not failures) produces 3–4 confirmed winners annually. Each winner compounding on the last is how CRO agencies generate 20–40% revenue lifts over 12-month engagements — it’s not one magic test, it’s systematic iteration.
Shopify A/B Testing Benchmarks: What “Good” Looks Like
| Metric | Shopify Average (2026) | Top Quartile (2026) | Primary Testing Lever |
|---|---|---|---|
| Overall Store Conversion Rate | 1.4% – 2.1% | 3.5% – 5.0% | Product page + checkout flow |
| Mobile Conversion Rate | 0.9% – 1.5% | 2.5% – 3.5% | Sticky ATC, page speed, mobile UX |
| Add-to-Cart Rate | 5% – 8% | 10% – 14% | Product images, pricing display, social proof |
| Cart-to-Checkout Rate | 45% – 58% | 65% – 78% | Shipping threshold messaging, trust signals |
| Checkout Completion Rate | 60% – 70% | 78% – 88% | One-page checkout, express payment options |
| Average Order Value (AOV) | Varies by category | 15–25% above category avg | Upsell placement, free shipping threshold |
| Email Pop-Up Submission Rate | 1.5% – 3% | 5% – 9% | Offer type, timing, exit-intent trigger |
Use these benchmarks as diagnostic filters. If your checkout completion rate is 55% and the average is 65%, that’s your highest-priority test area — not your homepage hero. Data-driven prioritization is what separates stores that see compounding CRO gains from those that run tests randomly and wonder why nothing moves.
Bringing It All Together
A/B testing on Shopify is not a tactic — it’s a discipline. The stores that build a systematic program around it, starting with behavioral data from GA4 and Hotjar, writing structured hypotheses, using purpose-built tools like Shoplift and Intelligems, and maintaining a disciplined test cadence, consistently pull away from competitors who rely on gut instinct and one-time redesigns. The 12 experiments in this guide cover the highest-impact areas of any Shopify store: product pages, cart, checkout, email capture, and upsell placement. Start with whichever one matches your highest traffic drop-off point identified in GA4. Run it clean, document the result, and let each winner compound into the next. That’s the entire playbook — and it works.