
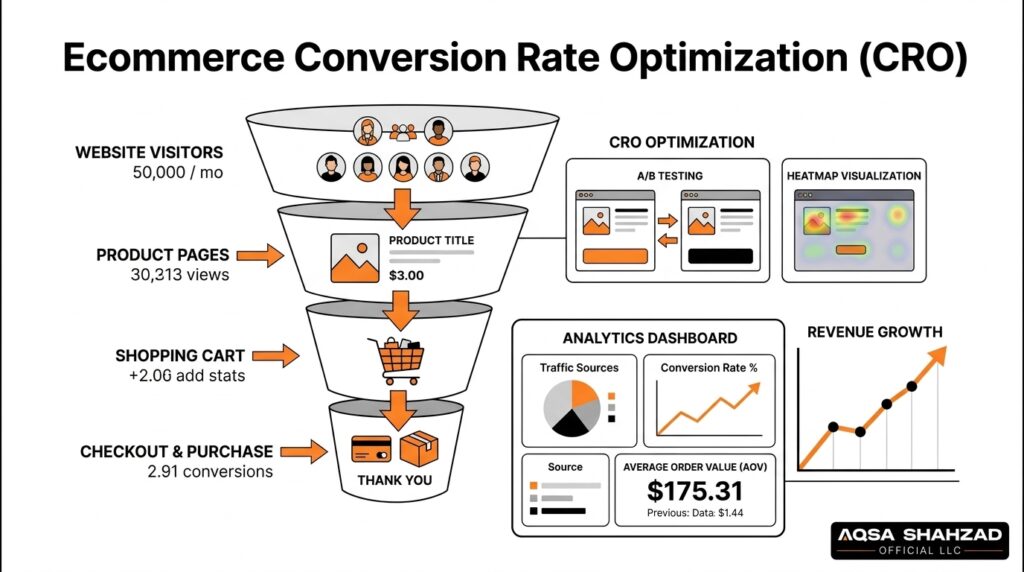
Most online stores don’t have a traffic problem. They have a leak problem. Shoppers add to cart, then disappear somewhere between the shipping estimate and the payment form.
These 15 ecommerce conversion rate optimization tips follow the customer journey, from the first product view to the final click on “Place order.” For each one, you’ll see what usually goes wrong, what to change, and which metric shows whether the change worked.
The math is simple: revenue = sessions × conversion rate × average order value (AOV). Take a hypothetical store with 50,000 monthly sessions, a 2% conversion rate, and an $80 AOV. It earns $80,000 a month. Lift conversion to 2.2% and AOV to $85, and the same traffic brings in about $93,500.
Key Takeaways
| Principle | What it means for you |
|---|---|
| Diagnose before you design | Find the funnel stage where shoppers drop off before changing anything. |
| Judge changes by revenue per visitor | A change that lifts conversion rate but cuts AOV can still lose money. |
| Surprise costs hurt checkout most | Show shipping, taxes, and fees early. |
| Best practices are hypotheses | Test on your own store. A tactic that works for one brand can fail for another. |
| Low traffic needs a different approach | If you can’t run a reliable A/B test, fix obvious usability problems first. |
What Is Ecommerce Conversion Rate Optimization?
Ecommerce conversion rate optimization (CRO) means raising the share of visitors who buy, and how much they spend, by removing friction, making things clearer, and building trust. It relies on analytics, user behavior research, UX, and testing rather than guesswork. Your conversion rate is orders divided by sessions, times 100.
Ecommerce CRO Statistics for 2026
According to Baymard Institute’s cart abandonment research, the average documented online cart abandonment rate is 70.22%. Among US shoppers who abandoned during checkout (excluding people who were just browsing), these were the most common reasons:
- 40% said extra costs like shipping, taxes, or fees were too high
- 20% said delivery was too slow
- 19% didn’t trust the site with their credit card information
- 18% were forced to create an account
- 17% found the checkout too long or complicated
- 9% didn’t have enough payment methods
Baymard also found that the average US checkout shows 23.48 form elements, while an ideal checkout needs only 12–14. Average ecommerce conversion rates vary too much by industry, price point, device, and traffic source to give one reliable benchmark, so treat any single “average” figure with caution.
The Ecommerce CRO Process: A 6-Step Framework
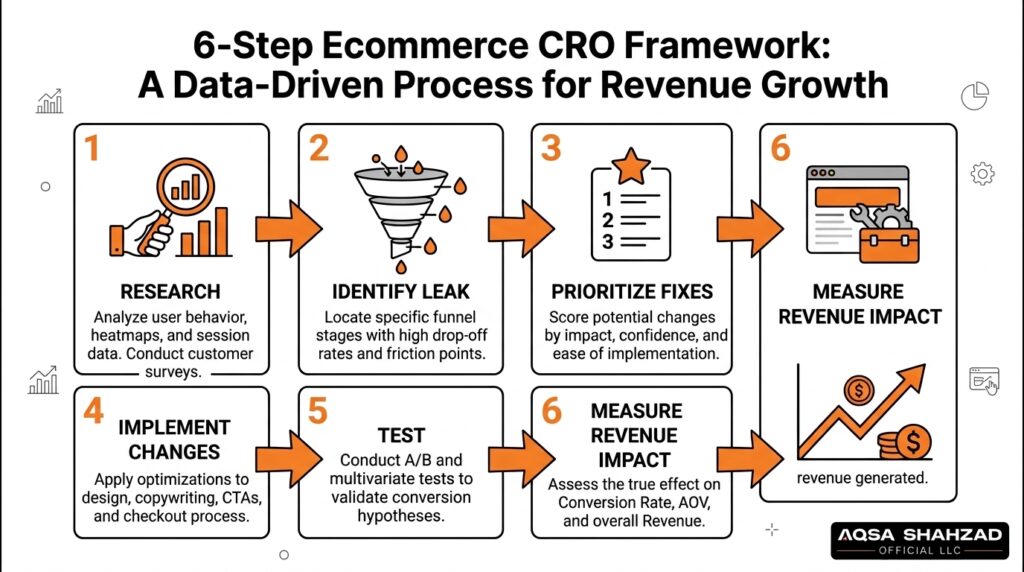
Good CRO follows a repeatable loop rather than a list of random fixes:
- Research. Review analytics, heatmaps, session recordings, and customer feedback.
- Identify the leak. Find the funnel stage with the biggest drop-off.
- Prioritize fixes. Score ideas by impact, confidence, and effort.
- Implement changes. Ship one clear change at a time.
- Test. A/B test where you have enough traffic, or track before and after carefully where you don’t.
- Measure revenue impact. Judge results on revenue per visitor, not clicks.
Then repeat. Each cycle teaches you something about your customers that makes the next one sharper.
15 Ecommerce Conversion Rate Optimization Tips
1. Find the Leak Before Fixing Anything
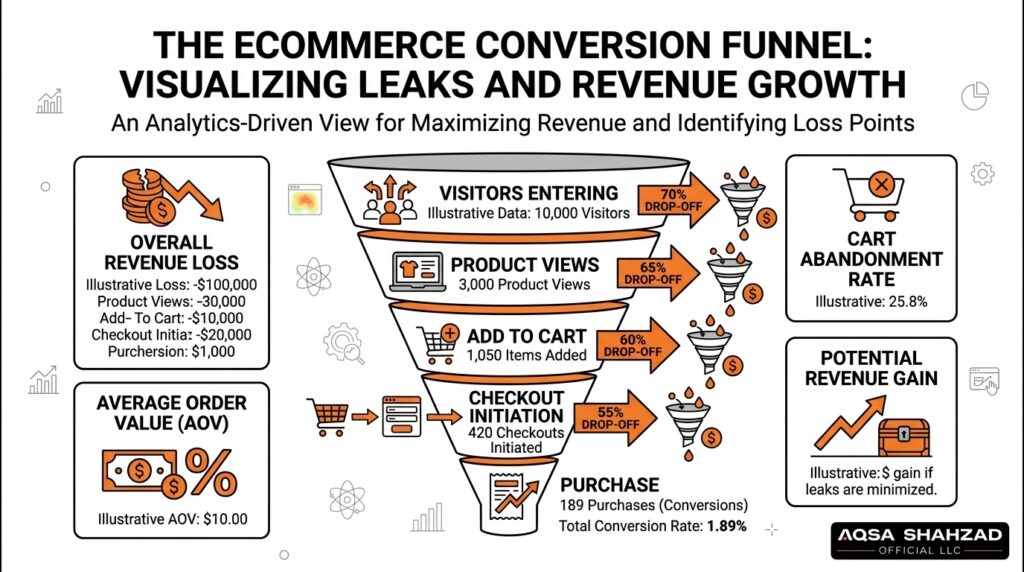
Build a funnel report in GA4 (product view → add to cart → checkout → purchase) and split it by device and channel. Then watch 20–30 session recordings of shoppers who reached checkout but didn’t buy, and look at heatmaps for your key pages. A free set of Shopify audit tools can help you get started.
Measure: drop-off at each funnel stage. Keep in mind that analytics shows correlation, not causation, so treat what you find as a hypothesis.
2. Make the Value Proposition Obvious Above the Fold
If the first screen of a product page shows only a name, a price, and a photo, shoppers have to work out why they should buy. Add a specific benefit line under the title (“Keeps drinks cold for 24 hours,” not “Premium quality”) and two or three scannable points. On Shopify, a metafield lets you manage this line for each product without custom code. Reviews and support tickets are the best source of the words your buyers actually use.
Measure: add-to-cart rate on the updated pages.
3. Use Images and Video That Answer Questions
Shoppers can’t touch the product, so your images have to do that work. Include scale shots, close-ups, lifestyle photos, and an image for every variant, so that picking “Navy” actually shows navy. Short videos help when fit or function matters. Compress files so the extra images don’t slow the page down.
Measure: add-to-cart rate and returns marked “looked different than pictured.” This matters most in apparel, beauty, and home goods.
4. Write Descriptions That Handle Objections
Good product copy answers the doubts that stop a purchase: Will it fit? Is it compatible? Is it worth the price? Go through your support inbox and return reasons to find the questions that keep coming up, then answer them with specs, a size guide, and a short FAQ in collapsible tabs.
Measure: add-to-cart rate, pre-purchase support tickets, and returns caused by sizing problems.
5. Put Reviews Where Hesitation Happens
Reviews buried at the bottom of the page do little. Show the star rating and review count near the product title, let shoppers filter reviews by things like size or use case, and add customer photos. A few honest mixed reviews often make the whole set more believable.
Measure: add-to-cart rate on products with reviews compared with similar products that have none.
6. Add Trust Signals Near the Buy Button
Nearly one in five shoppers who abandon checkout don’t trust the site with their card details. Put specific trust cues near Add to Cart and in checkout: payment logos, “Free 30-day returns,” delivery times, and easy contact options. A few meaningful signals work better than a wall of badges.
Measure: checkout completion rate for first-time visitors.
7. Show Shipping Costs, Delivery Dates, and Returns Early
Unexpected costs are the top reason shoppers abandon checkout. A $7 fee shown on the product page reads as information. The same fee revealed at the last step feels like a trick. Show a delivery estimate (“Arrives by Thursday”) and a one-line returns summary near the buy button. If you offer free shipping over a set amount, set that threshold slightly above your current AOV.
Measure: the rate at which carts move to checkout, and AOV.
8. Improve Navigation and Collection Filters
Shoppers who can’t find a product assume you don’t sell it. Build menus around how customers shop, and give collection pages filters for size, price, color, and use case. On Shopify, you can set these up with the Search & Discovery app. Test the filters on mobile, because that’s where they most often break.
Measure: the share of sessions that reach a product page, and exits from collection pages.
9. Treat Site Search as a Sales Channel
People who use site search are telling you exactly what they want. Once a month, review your search terms report and fix queries that return nothing by adding synonyms or tags. If shoppers search “pants” and your products are tagged “trousers,” you’re losing sales you could keep with a ten-minute fix.
Measure: the zero-result rate, and conversion rate for sessions that use search.
10. Design for Mobile First
Review every key page on a real phone. Use a sticky Add to Cart button, make tap targets large, and keep pop-ups easy to close. Watch session recordings filtered to mobile to see where people struggle.
Measure: the gap between mobile and desktop conversion rates. Some gap is normal, so watch for unusually large ones.
11. Speed Up Your Store
Heavy themes and a pile of apps slow down many Shopify stores. Aim to meet Google’s Core Web Vitals thresholds: largest contentful paint (LCP) under 2.5 seconds, interaction to next paint (INP) under 200 milliseconds, and cumulative layout shift (CLS) under 0.1. Remove apps you don’t use, compress images, and lazy-load anything below the fold. Deeper theme problems usually need dedicated Shopify speed optimization work.
Measure: the share of pages passing Core Web Vitals in Google Search Console. The gains come gradually rather than overnight.
12. Optimize the Cart and Recover Abandoners
The cart is where hesitation peaks. Show a clear total, make it easy to change quantities, and add a free-shipping progress bar. Then set up abandonment emails and SMS for shoppers who leave anyway. The best Shopify cart abandonment fixes pair on-site changes with timely reminders, and our guide to Shopify cart abandonment fixes covers both. If you need help building the flows, our email and SMS marketing team can set them up.
Measure: cart abandonment rate and incremental revenue recovered. Try a reminder without a discount first, so customers don’t learn to abandon carts on purpose.
13. Remove Checkout Friction
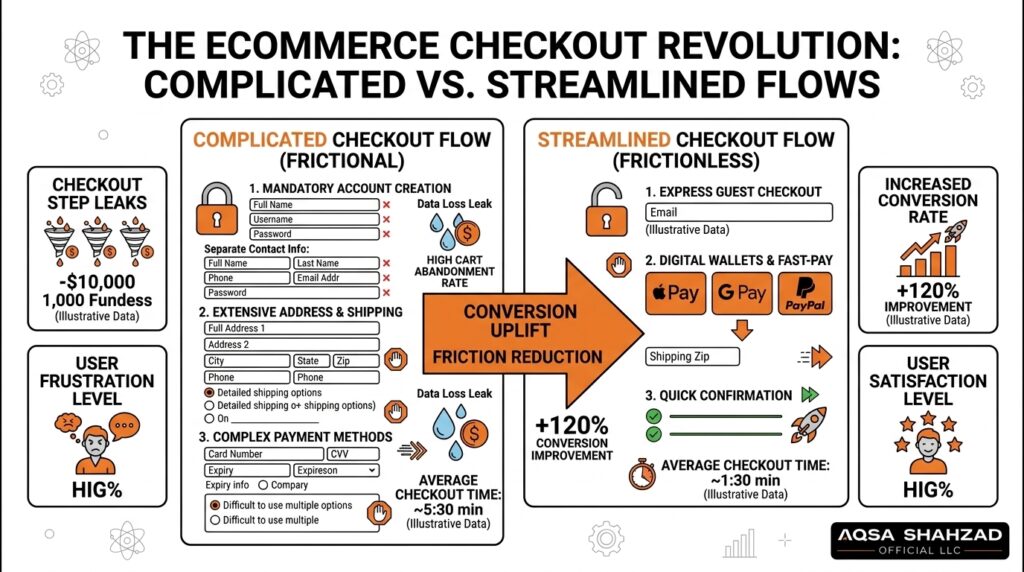
Forced account creation and long forms are two of the biggest checkout killers (see the statistics above). Offer guest checkout, cut fields you don’t need, turn on address autocomplete, and enable accelerated checkouts like Shop Pay, Apple Pay, and Google Pay. Our Shopify checkout optimization guide goes deeper.
| Friction point | Fix |
|---|---|
| Forced account creation | Guest checkout, with an optional account after purchase |
| Too many form fields | Remove optional fields and use autocomplete |
| Limited payment methods | Add digital wallets and a buy-now-pay-later option |
| A visible discount-code field | Show active offers upfront so shoppers don’t leave to hunt for codes |
Measure: checkout completion rate and drop-off at each checkout step.
14. Raise AOV With Relevant Upsells
A higher AOV raises revenue per visitor even when conversion rate stays flat. Offer complementary items, bundles, and relevant upgrades in the cart drawer or as post-purchase offers. Irrelevant widgets on the product page tend to distract more than they sell. The Shopify upsell strategies AOV-focused brands rely on all make the offer feel like help. For formats and placement, see our guide to Shopify upsell strategies AOV growth depends on.
Measure: AOV, attach rate, and conversion rate. An upsell that raises AOV but lowers checkout completion can still cost you revenue.
15. Test Against Revenue, Not Clicks
Write a hypothesis grounded in research, pick one main metric (usually revenue per visitor), and run each test for at least two full weeks. Don’t stop a test early just because it looks like a winner. Our Shopify A/B testing guide lists experiments worth running. Lower-traffic stores should rely more on session recordings and careful before-and-after tracking.
Measure: revenue per visitor, split by device.
How to Prioritize Ecommerce CRO Fixes
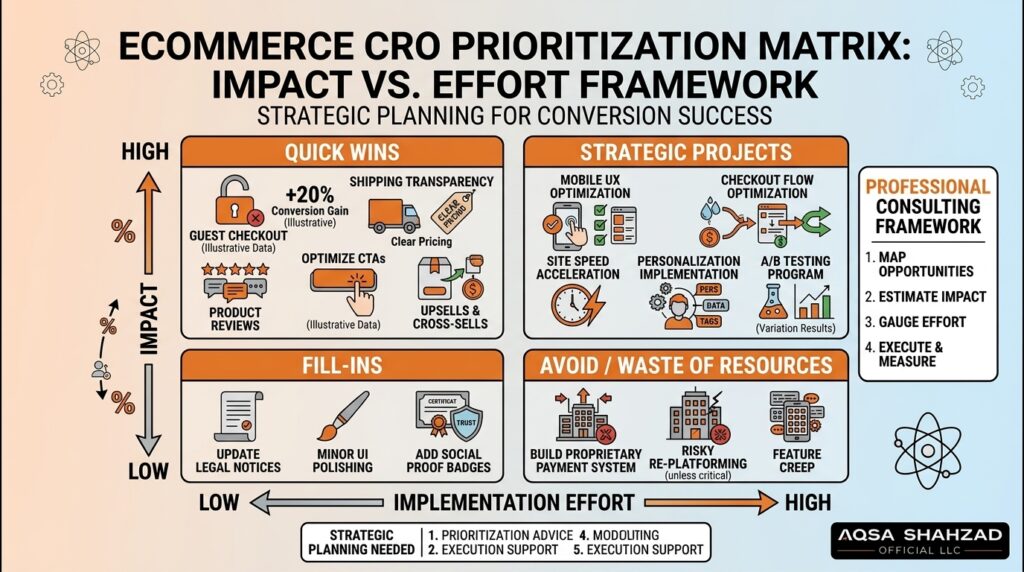
Start with fixes that have high impact and low effort, then work toward bigger projects. Checkout and cart fixes usually come first because every shopper there already intends to buy.
| Priority | Fixes | Why |
|---|---|---|
| High impact, easy to implement | Guest checkout, shipping transparency, reviews on product pages | Removes known abandonment triggers with little development work |
| High impact, medium effort | Mobile UX improvements, checkout optimization, site speed | Needs theme or app changes but affects every session |
| High impact, advanced | A/B testing program, personalization, advanced upsell systems | Needs enough traffic, clean tracking, and ongoing resources |
Match this to your biggest leak. If carts and checkouts are losing buyers, start with Shopify cart abandonment fixes and checkout friction. If conversion rate is healthy but revenue is flat, the Shopify upsell strategies AOV data supports may matter more.
Common Ecommerce CRO Mistakes
- Redesigning without data. A new look can hide the real problem, or create new ones.
- Hiding shipping costs until checkout. It’s the most common reason shoppers abandon.
- Ignoring mobile users. Reviewing only on desktop misses where most friction happens.
- Running too many apps. Every script slows the store and can clash with others.
- Testing multiple variables at once. If a variant changes the headline, images, and price together, you won’t know which one worked.
- Judging success on conversion rate alone. A discount can lift conversions while lowering revenue per visitor.
SEO vs. CRO: What’s the Difference?
SEO brings more qualified visitors to your store. CRO turns more of those visitors into buyers. They work best together, because better conversion makes every visitor SEO brings in worth more.
| SEO | CRO | |
|---|---|---|
| Focus | Traffic from organic search | Conversions from existing traffic |
| Main question | “How do more people find us?” | “Why aren’t visitors buying?” |
| Timeline | Usually months to build | Individual fixes can show results in weeks |
| Primary KPI | Organic sessions, rankings | Conversion rate, revenue per visitor |
| Common tools | Google Search Console, keyword tools | GA4, heatmaps, session recordings, A/B testing tools |
When to Get Expert Help
As a store grows, running tests well takes clean tracking, development time, and sound statistical judgment. That’s usually when structured Shopify conversion rate optimization support becomes worth considering. The CRO retainer vs audit choice depends on your traffic and your in-house capacity. A free Shopify CRO audit gives you a prioritized roadmap, while a CRO experimentation retainer covers ongoing testing. Our CRO retainer vs audit breakdown compares the two.
Frequently Asked Questions
What is a good ecommerce conversion rate?
There’s no universal “good” rate. It varies by industry, price point, device, and traffic source. The most reliable benchmark is your own store’s past results, segmented by device and channel.
How can I increase my ecommerce conversion rate quickly?
Start near checkout. Show shipping costs early, offer guest checkout, enable accelerated payment options, and fix mobile usability problems. These changes help shoppers who already plan to buy.
How long does ecommerce CRO take to show results?
Simple fixes can show measurable changes within a few weeks. A/B tests usually need at least two full weeks, and longer on lower-traffic stores. Compounding revenue gains typically come from several months of steady testing.
What is a CRO audit?
A CRO audit is a structured review of your store’s analytics, user behavior, UX, speed, and checkout. It finds where you lose buyers and why. The result is a prioritized list of fixes ranked by likely impact and effort, so you know what to work on first.
Should I choose a CRO retainer vs audit?
Choose an audit if you need a prioritized list of fixes and can implement them yourself. Choose a retainer if you have enough traffic for continuous testing and need ongoing research and development support.
How much does ecommerce CRO cost?
Cost depends on scope. That means whether you need a one-time audit or ongoing testing, how much development each fix needs, and which testing tools you use. Many fixes in this guide cost little beyond time. For professional support, compare scope and deliverables, not just price.
What tools are used for ecommerce CRO?
Most stores use GA4 or Shopify Analytics for funnel data, a heatmap and session recording tool such as Microsoft Clarity or Hotjar for behavior, an A/B testing tool that reports on revenue, and review and email apps. Google Search Console and PageSpeed Insights help track Core Web Vitals.
How often should you run CRO tests?
Run tests continuously if your traffic allows, one test per page or funnel step at a time. Each test should run at least two full weeks and until it reaches its planned sample size. Lower-traffic stores may manage only a few reliable tests a year and should focus on usability fixes.
What is revenue per visitor (RPV)?
Revenue per visitor is total revenue divided by total sessions. It combines conversion rate and average order value into one number, which makes it the best single metric for most CRO tests. A change that raises conversion rate but lowers RPV is usually not a win.
What’s the difference between CRO and UX design?
UX design shapes how easy and pleasant a site is to use. CRO uses research and testing to change the site in ways that measurably increase conversions and revenue. Good UX supports CRO, but CRO judges every change by its business result.
Conclusion
Effective ecommerce CRO starts with understanding user behavior, not redesigning on instinct. Find where shoppers drop off, learn why, and remove friction at those points. Measure every change against revenue per visitor, checkout completion, and AOV. Not every tactic will work for your store, which is why testing matters. Whether your next step is Shopify cart abandonment fixes, refining the Shopify upsell strategies AOV gains come from, or settling the CRO retainer vs audit question, start with your biggest leak.