

Your Shopify product page conversion rate sits at 1.8%, GA4 says most sessions land there from paid search, and nobody on your team can tell you why visitors leave without adding to cart. That is the normal starting point for most stores doing $50K to $5M a year. The median Shopify product page conversion rate across mid-market stores is somewhere between 1.5% and 3%, according to aggregated Shopify Plus benchmark data, which means half the merchants reading this are underperforming their own category without knowing it.
- Shopify product page conversion rate is the percentage of PDP visitors who add to cart or purchase, and it varies heavily by traffic source and price point.
- Fixing it starts with PDP-specific analytics, not store-wide averages, because a single low-performing template can drag down blended conversion numbers.
- Good PDP conversion in 2026 ranges from 2% to 5% depending on vertical, with top-quartile Shopify Plus stores clearing 6%+.
- Tools like Hotjar, Microsoft Clarity, Intelligems, and Rebuy each solve a different piece of the diagnosis-to-fix pipeline.
- Most PDP optimization programs show measurable lift within 4 to 8 weeks, but compounding gains take a full quarterly testing cycle.
What Is Shopify Product Page Conversion Rate?
Shopify product page conversion rate is the share of visitors to a specific product detail page who complete a target action, usually add-to-cart or purchase, measured against total PDP sessions rather than site-wide sessions. This distinction matters because your homepage or collection page conversion rate can mask a broken PDP entirely.
In GA4, you build this as a custom exploration: filter sessions by page path containing /products/, then compare add_to_cart events against page_view events for that same path. Shopify’s native Analytics dashboard under Analytics> Reports> Behaviour> Sessions by product gives you a rougher version of this without the event-level granularity.
Most merchants conflate two different numbers. Add-to-cart rate measures whether your PDP itself is persuasive: images, price clarity, shipping info, reviews, variant selection. PDP-to-purchase rate includes everything downstream, cart abandonment, checkout friction, shipping cost surprises. Treating these as one metric is the single most common diagnostic error we see when auditing Shopify Plus stores.
A store with a strong 12% add-to-cart rate but a weak 15% cart-to-purchase rate has a checkout problem, not a PDP problem, even though the blended “conversion rate” number looks identical to a store with the opposite split. Segmenting by device matters too. Mobile PDP sessions typically convert at 40% to 60% of desktop rate on the same product, according to Baymard Institute mobile commerce research, so a blended average across devices tells you almost nothing actionable.
How Do You Improve Shopify Product Page Conversion Rate?
Improving PDP conversion is a sequence, not a single redesign. Skipping the diagnosis step and jumping straight to a theme overhaul is why so many “conversion redesigns” ship flat or negative results.
Diagnose Before You Redesign
- Pull PDP-specific funnel data from GA4 for your top 20 SKUs by traffic, not your top 20 by revenue.
- Install session recordings with Hotjar or Microsoft Clarity on your three highest-traffic PDPs and watch a minimum of 30 sessions each.
- Run a heatmap scroll-depth report to find where attention drops off before the fold that matters, usually the add-to-cart button or the shipping/returns info.
- Check Core Web Vitals for the PDP template specifically in PageSpeed Insights, not just your homepage, since Shopify theme apps often bloat product pages more than any other template.
Fix the Highest-Leverage Elements First
Baymard Institute’s PDP usability research consistently ranks these as the highest-impact elements, in order: product imagery quality and zoom, price and shipping cost transparency, variant selection clarity (size, color, bundle), and social proof placement above the fold. Shopify-specific fixes we deploy repeatedly:
- Move shipping and delivery estimate text directly under the price, not buried in a tab, using a metafield-driven delivery date app or a custom Liquid snippet pulling from your fulfillment data.
- Replace generic “Add to Cart” copy with inventory-aware urgency only when it is true, such as “Only 4 left in your size”, pulled live from variant inventory via a Shopify Function or theme app extension.
- Add review count and star rating directly beneath the product title using Judge.me or Okendo’s PDP widget, not just on a separate tab.
- Simplify variant pickers with swatches instead of dropdowns for color and size, which Baymard’s testing shows reduces selection errors and cart abandonment.
Test, Don’t Guess
Once you have a prioritized backlog, run controlled A/B tests using Shopify’s native tools or Intelligems for price and PDP layout testing. Never ship a PDP redesign store-wide based on internal opinion alone. For a full testing framework, see our Shopify A/B Testing Guide: 12 Tactical Tests to Run in 2026.
What Does Good Shopify Product Page Conversion Rate Look Like in 2026?
“Good” depends entirely on price point, category, and traffic source, so a single benchmark number is close to useless without context. That said, merchants ask for a number, so here is a realistic range based on aggregated Shopify Plus performance data across verticals we work in.
| Category | Below Average | Solid | Top Quartile |
|---|---|---|---|
| Apparel and fashion | Under 1.5% | 2% to 3.5% | 5%+ |
| Beauty and personal care | Under 2% | 3% to 4.5% | 6%+ |
| Home goods and furniture | Under 1% | 1.5% to 2.5% | 4%+ |
| Electronics and accessories | Under 1.8% | 2.5% to 4% | 5.5%+ |
| Food and beverage (subscription-eligible) | Under 2% | 3% to 5% | 7%+ |
These figures are add-to-cart rate on PDP sessions, not full-funnel purchase conversion, which will always be lower. If your paid social traffic converts at half your organic search traffic on the same PDP, that is expected and not a sign your page is broken. It usually means your ad creative is setting expectations your PDP doesn’t reinforce, which is a message-match problem, not a design problem.
2026 has raised the baseline for what “good” means because Core Web Vitals now factor more heavily into both organic ranking and paid Quality Score, and mobile-first PDP design is table stakes rather than differentiation. Stores still running unoptimized image carousels, render-blocking review apps, or bloated third-party scripts on their PDP template are actively losing both traffic and conversion, not just conversion.

Which Tools Help With Shopify Product Page Conversion Rate?
No single app fixes PDP conversion. You need a stack that covers diagnosis, testing, and execution, and most stores are missing at least one layer.
- Microsoft Clarity and Hotjar for session recordings and heatmaps, free tier available on Clarity, which is enough for stores under $2M in revenue.
- GA4 with a custom exploration report for PDP-specific funnels, since Shopify’s native analytics won’t segment add-to-cart by device and traffic source simultaneously.
- Google PageSpeed Insights, Lighthouse, and WebPageTest for PDP-template-specific Core Web Vitals, run against an actual product URL, not your homepage.
- Intelligems for PDP and pricing A/B tests that need statistically valid traffic splitting beyond what Shopify’s native tools offer.
- Rebuy for personalized PDP upsell and cross-sell modules that lift average order value without adding checkout friction.
- Okendo or Judge.me for review widgets with schema markup that also improves rich snippet visibility in search.
The mistake we see most is stores installing five conversion apps that each add their own JavaScript bundle, then wondering why Largest Contentful Paint on the PDP is 4.2 seconds. Audit your installed apps under Settings> Apps and sales channels quarterly and remove anything not actively driving a measured lift. For a deeper checkout-side companion to this PDP work, read Shopify Checkout Optimization: 5 Fixes That Work in 2026, since PDP gains often get erased by checkout friction downstream.
How Long Does Shopify Product Page Conversion Rate Take to Improve?
Most PDP optimization work shows a measurable directional signal within 2 to 4 weeks if you’re running a proper A/B test with adequate traffic volume, but statistically confident results on a mid-traffic PDP (under 5,000 sessions a month) can take 6 to 8 weeks per test.
The timeline breaks into three phases:
- Diagnosis (1 to 2 weeks): analytics setup, session recording review, heatmap analysis, and Core Web Vitals audit across your top PDP templates.
- First test cycle (2 to 6 weeks): depends entirely on your monthly PDP traffic and the size of the effect you’re testing for. A 20% lift is detectable faster than a 3% lift.
- Compounding cycle (one full quarter): running 3 to 5 sequential tests on the same PDP template, each building on the last winner, is where most of the real revenue lift accumulates.
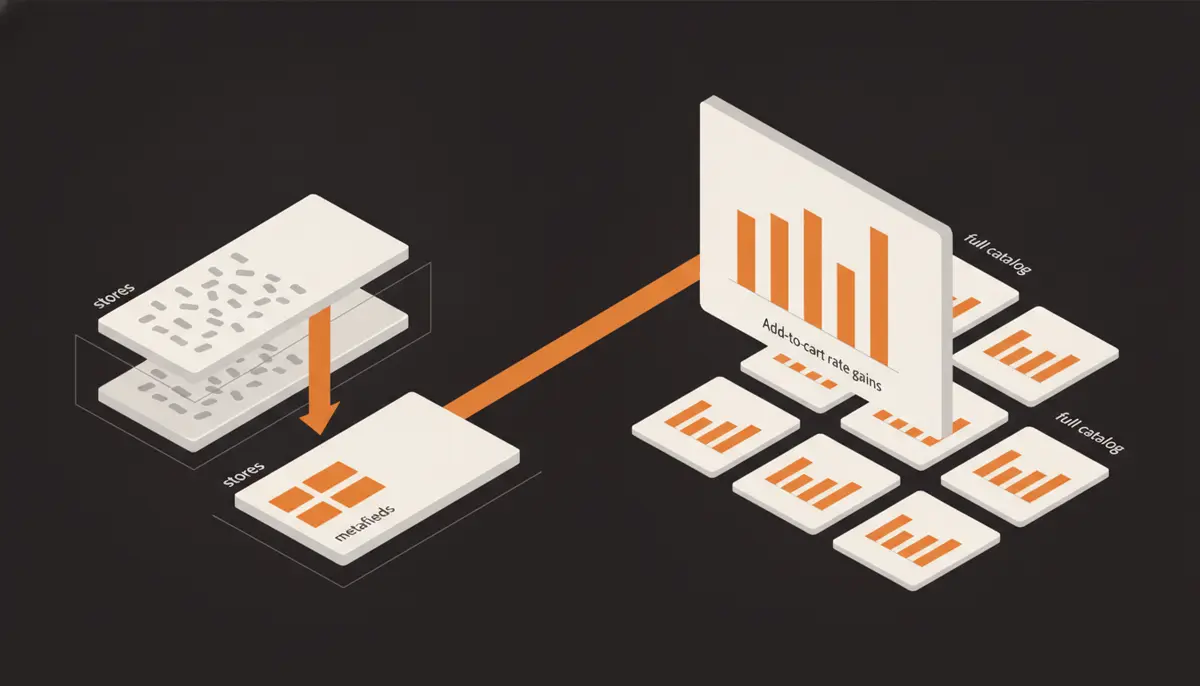
Stores with under 1,000 monthly PDP sessions per product should not run isolated PDP A/B tests at all, since the statistical power isn’t there. Instead, apply Baymard-validated best practices directly (shipping transparency, review placement, variant clarity) without testing, and save split-testing budget for your highest-traffic templates. Full-catalog rollouts of a proven template change, once validated on your top 3 to 5 SKUs, typically take another 2 to 3 weeks of dev time on Shopify Plus depending on how many metafield-driven variations exist across your catalog.
PDP Optimization vs. Checkout Optimization: Where to Spend First
Merchants often ask whether to fix the product page or the checkout first when the budget only covers one initiative this quarter. The honest answer depends on where your funnel leaks hardest, which you find from the GA4 funnel exploration described above.
PDP Optimization Wins When
- Add-to-cart rate is below 2% on your top 10 SKUs by traffic
- Session recordings show visitors leaving without scrolling past the fold
- Bounce rate on PDP sessions exceeds 55%
- Mobile PDP conversion is under half of desktop on the same products
Checkout Optimization Earns Its Cost When
- Add-to-cart rate is healthy (above 4%) but cart-to-purchase is under 30%
- Shipping cost is only revealed at the final checkout step
- Guest checkout isn’t the default and account creation is forced
- Cart abandonment emails in Klaviyo show high open rates but low click-through
If both numbers look bad simultaneously, which happens more often than merchants expect, start with checkout. A broken checkout caps the ceiling on every PDP improvement you make, since you’re just feeding more qualified traffic into the same leak.
Using Metafields and Liquid to Scale PDP Changes Across Your Catalog
The tactic that separates a one-off theme tweak from a real Shopify Plus PDP program is building changes on metaobjects and metafields instead of hardcoding content into a single product template. If you manually edit Liquid for every product to add a size guide or delivery estimate, that work doesn’t scale past a few dozen SKUs.
Set up a metafield definition under Settings> Custom data> Products for structured PDP content: delivery estimate ranges, size guide references, material composition, or care instructions. Reference these in your product template Liquid file with conditional logic so the block only renders when the metafield has a value, avoiding empty UI on SKUs that haven’t been populated yet.
For stores with more complex variant logic, such as bundle products or build-your-own kits, Shopify Functions let you customize cart and checkout behavior without forking the entire checkout flow, which matters for Plus merchants who need custom logic but still want to stay on Shopify’s hosted, PCI-compliant checkout. This approach is also what we used in the Gene Juarez Shopify Plus and Zenoti build, where service-product PDPs needed booking-aware inventory logic that a standard theme couldn’t handle.
Mobile-Specific PDP Fixes That Move the Needle
Mobile traffic is the majority of PDP sessions for most Shopify stores now, yet mobile conversion still lags desktop badly on unoptimized templates. The fixes here are narrower and more mechanical than desktop redesigns. If you want this checked against your own store, request a free Shopify CRO audit.
- Add a sticky add-to-cart bar that appears after the visitor scrolls past the primary product image, keeping the CTA reachable without scrolling back up.
- Compress and lazy-load product images using Shopify’s built-in image CDN parameters rather than relying on a third-party image optimization app that adds its own script weight.
- Collapse secondary content (shipping policy, size guide, full description) into accordions so the fold prioritizes price, variant selection, and the add-to-cart button.
- Test tap target sizing on variant swatches and quantity selectors, since Baymard’s mobile usability testing repeatedly flags undersized tap targets as a top source of selection errors.
PDP Conversion Pre-Flight Checklist
- GA4 funnel exploration set up for PDP-specific add-to-cart and purchase events
- Session recordings reviewed for at least 30 sessions on top 3 PDPs
- Core Web Vitals checked on an actual product URL in PageSpeed Insights, not the homepage
- Shipping cost and delivery estimate visible above the fold, not buried in a tab
- Review count and star rating visible near the product title
- Mobile sticky add-to-cart bar implemented and tested on at least two device sizes
- Third-party app scripts audited under Settings> Apps and sales channels for load impact
Conclusion
Shopify product page conversion rate isn’t a single number to chase, it’s a diagnostic signal that points you toward specific, fixable friction points on your highest-traffic PDPs. Start with segmented analytics, fix the highest-leverage Baymard-validated elements first, and use metafields so improvements scale across your catalog instead of living on one hand-edited template. If your current PDP add-to-cart rate is below the “solid” range in the benchmark table above, that gap is recoverable revenue sitting in your existing traffic, not a traffic acquisition problem at all.